Nginx服务纳入到zabbix监控-创新互联
工作中有用到Nginx做负载均衡,所以想尝试一下,把Nginx服务用zabbix监控起来

记录下操作步骤,以防下次忘记
涉及的实验环境:
服务器操作系统:CentOS 7.2
zabbix版本:zabbix-2.2.5
Nginx版本:nginx-1.10.1
要做监控步骤前,先查看下当前Nginx中是否加载了--with-http_stub_status_module的模块。
# /data0/nginx/sbin/nginx -V nginx version: nginx/1.10.1 built by gcc 4.8.5 20150623 (Red Hat 4.8.5-11) (GCC) built with OpenSSL 1.0.1e-fips 11 Feb 2013 TLS SNI support enabled configure arguments: --prefix=/data0/nginx --pid-path=/data0/nginx/logs/nginx.pid --user=nginx --group=nginx --with-http_ssl_module --with-http_flv_module --with-http_stub_status_module --with-http_gzip_static_module --http-client-body-temp-path=/var/tmp/nginx/client/ --http-proxy-temp-path=/var/tmp/nginx/proxy/ --http-fastcgi-temp-path=/var/tmp/nginx/fcgi/ --http-uwsgi-temp-path=/var/tmp/nginx/uwsgi --http-scgi-temp-path=/var/tmp/nginx/scgi --with-pcre --add-module=/root/nginx_upstream_check_module-master/ --add-module=/data0/soft/ngx_cache_purge-master/因为这边zabbix是根据nginx的Stub Status模块,来抓取Status模块所提供的数据。
假如从前尚未开启此模块,现在想启用StubStatus模块,你可以重新编译nginx源码安装包,然后在编译时记得加上参数 --with-http_stub_status_module,执行./configure && make就可以了,不用make install,如果make install记得先备份下,配置文件nginx.conf,以防止配置文件的内容都遗失了。
因为Nginx配置时,我都有加载此模块,所以就不多加介绍了。
重新加载nginx模块可以参照我之前写的博客
http://10803382.blog.51cto.com/10793382/1924871
在你的nginx.conf确认下,有没有下列内容,如果没有,那你可以在nginx.conf当中添加查看nginxstatus配置后,重启nginx服务即可。
# vim /data0/nginx/conf/nginx.conf ##找到server模块,server{}里加入下面的内容 #20170627 Nginx监控设置 location /nginxstatus{ stub_status on; access_log /data0/nginx/logs/status.log; allow 10.60.0.71; ##允许zabbix监控主机内网IP访问 allow 10.60.0.163; ##允许nginx本机内网IP访问 deny all; auth_basic "nginxstatus"; } #20170627 END因为限定可访问IP,有助于保护网址安全
# /data0/nginx/sbin/nginx -t nginx: the configuration file /data0/nginx/conf/nginx.conf syntax is ok nginx: configuration file /data0/nginx/conf/nginx.conf test is successful # /data0/nginx/sbin/nginx -s reload查看你设置好的nginxstatus连接状况
http://网址/nginxstatus
# curl http://127.0.0.1/nginxstatus <html> <head><title>301 Moved Permanently</title></head> <body bgcolor="white"> <center><h2>301 Moved Permanently</h2></center> <hr><center>nginx/1.10.1</center> </body> </html>你会发现出现了错误提示,显示了301 网站有设定了永久重定向,
如果你和我是一样的情况,网址做了https,那么请在nginx主机、zabbix监控主机上用网址来访问即可
# curl https://www.sss.com/nginxstatus Active connections: 9 server accepts handled requests 1453770 1453770 2718730 Reading: 0 Writing: 4 Waiting: 5注:
Activeconnections:对后端发起的活动连接数;
server accepts :nginx 总共处理了1453770个连接;
handled:成功创建了1453770次握手;
requests:总共处理了2718730个请求。
Reading:nginx读取客户端的header数;
Writing: nginx 返回给客户端的header数;
Waiting: nginx 请求处理完成,正在等待下一请求指令的连接。
在上面的准备工作完了以后,接下来,我们就要开始在nginx的那台机器上编辑一个可以让zabbix服务器获取到数据的脚本
注:因为我的网站做了https,所以不是像别人一样直接访问IP和端口就可以了,我就直接访问网址即可
# vim /data0/zabbix/scripts/nginx_status.sh #!/bin/bash # Script is userd to fetch nginx statuses for zabbix monitoring systems # Set Variables BKUP_DATE=`/bin/date +%Y%m%d` LOG="/data0/zabbix/log/webstatus.log" HOST=www.sss.com export HOST # Function used to check the process of nginx function ping { ps -ef |grep nginx | wc -l } # Functions to return nginx stats function active { /usr/bin/curl "https://$HOST/nginxstatus" 2>/dev/null| grep 'Active' | awk '{print $NF}' } function reading { /usr/bin/curl "https://$HOST/nginxstatus" 2>/dev/null| grep 'Reading' | awk '{print $2}' } function writing { /usr/bin/curl "https://$HOST/nginxstatus" 2>/dev/null| grep 'Writing' | awk '{print $4}' } function waiting { /usr/bin/curl "https://$HOST/nginxstatus" 2>/dev/null| grep 'Waiting' | awk '{print $6}' } function accepts { /usr/bin/curl "https://$HOST/nginxstatus" 2>/dev/null| awk NR==3 | awk '{print $1}' } function handled { /usr/bin/curl "https://$HOST/nginxstatus" 2>/dev/null| awk NR==3 | awk '{print $2}' } function requests { /usr/bin/curl "https://$HOST/nginxstatus" 2>/dev/null| awk NR==3 | awk '{print $3}' } # Run the requested function $1#上面是根据我的情况设定的,当然还有其他更简洁的方式,但因为可以实现想要的功能,所以就先不进行更改了。
赋予脚本可执行权限
# chmod +x nginx_status.sh将脚本更改至zabbix用户和群组管理
# chown zabbix:zabbix nginx_status.sh# ll nginx_status.sh -rwxr-xr-x 1 zabbix zabbix 1168 Jun 27 13:58 nginx_status.sh在本地查看下你的设定是否可以出结果,不然出错,却没有发现,后面可能就没有办法收取到数据,也可以及时排错。
# /usr/bin/curl "https://www.sss.com/nginxstatus" 2>/dev/null| grep 'Active' | awk '{print $NF}' 12上面数据一个个试过,如果可以像上面一样能出数据,说明没有问题。那你就可以到zabbix客户端去添加Nginx服务的模块获取设定
# grep -v "^[#;]" /data0/zabbix/etc/zabbix_agentd.conf | grep -v "^$" LogFile=/tmp/zabbix_agentd.log Server=10.60.0.71 ##zabbix server监控主机的IP地址 ServerActive=10.60.0.71 ##zabbix server监控主机的IP地址 Hostname=10.60.0.163 ##zabbix client 即本机nginx的IP地址 UnsafeUserParameters=1 ##默认情况下可能没有开启,那么你就把前面的注释去掉即可那么在zabbix_agentd.conf里随便找个位置添加下列设定即可,我是放在了UnsafeUserParameters下面。
# vim /data0/zabbix/etc/zabbix_agentd.conf UserParameter=nginx.accepts,/data0/zabbix/scripts/nginx_status.sh accepts UserParameter=nginx.handled,/data0/zabbix/scripts/nginx_status.sh handled UserParameter=nginx.requests,/data0/zabbix/scripts/nginx_status.sh requests UserParameter=nginx.connections.active,/data0/zabbix/scripts/nginx_status.sh active UserParameter=nginx.connections.reading,/data0/zabbix/scripts/nginx_status.sh reading UserParameter=nginx.connections.writing,/data0/zabbix/scripts/nginx_status.sh writing UserParameter=nginx.connections.waiting,/data0/zabbix/scripts/nginx_status.sh waiting重启下zabbix agent服务,让我们刚刚的配置设定生效
# pkill -9 zabbix_agentd # /data0/zabbix/sbin/zabbix_agentd现在关于zabbix client端的设定都已经完毕。转站zabbix server监控主机
首先测试zabbix server是否可以通过zabbix_get来获取到zabbix client端Nginx服务的数据
# /usr/local/zabbix/bin/zabbix_get -s 10.60.0.163 -p 10050 -k "nginx.accepts" 1422577# /usr/local/zabbix/bin/zabbix_get -s 10.60.0.163 -p 10050 -k "nginx.handled" 1422800# /usr/local/zabbix/bin/zabbix_get -s 10.60.0.163 -p 10050 -k "nginx.requests" 2654085# /usr/local/zabbix/bin/zabbix_get -s 10.60.0.163 -p 10050 -k "nginx.connections.active" 17# /usr/local/zabbix/bin/zabbix_get -s 10.60.0.163 -p 10050 -k "nginx.connections.reading" 0# /usr/local/zabbix/bin/zabbix_get -s 10.60.0.163 -p 10050 -k "nginx.connections.writing" 3# /usr/local/zabbix/bin/zabbix_get -s 10.60.0.163 -p 10050 -k "nginx.connections.waiting" 9从上面上看,Nginx服务被监控项都是没有问题的。
在网上搜索到适合你用Nginx status的zabbix模板,然后把模板导入到zabbix web内,下面是我在自己的zabbix web上汇出的Nginx status的模板。如果觉得合适,也可以在文章最下方下载我的模板。
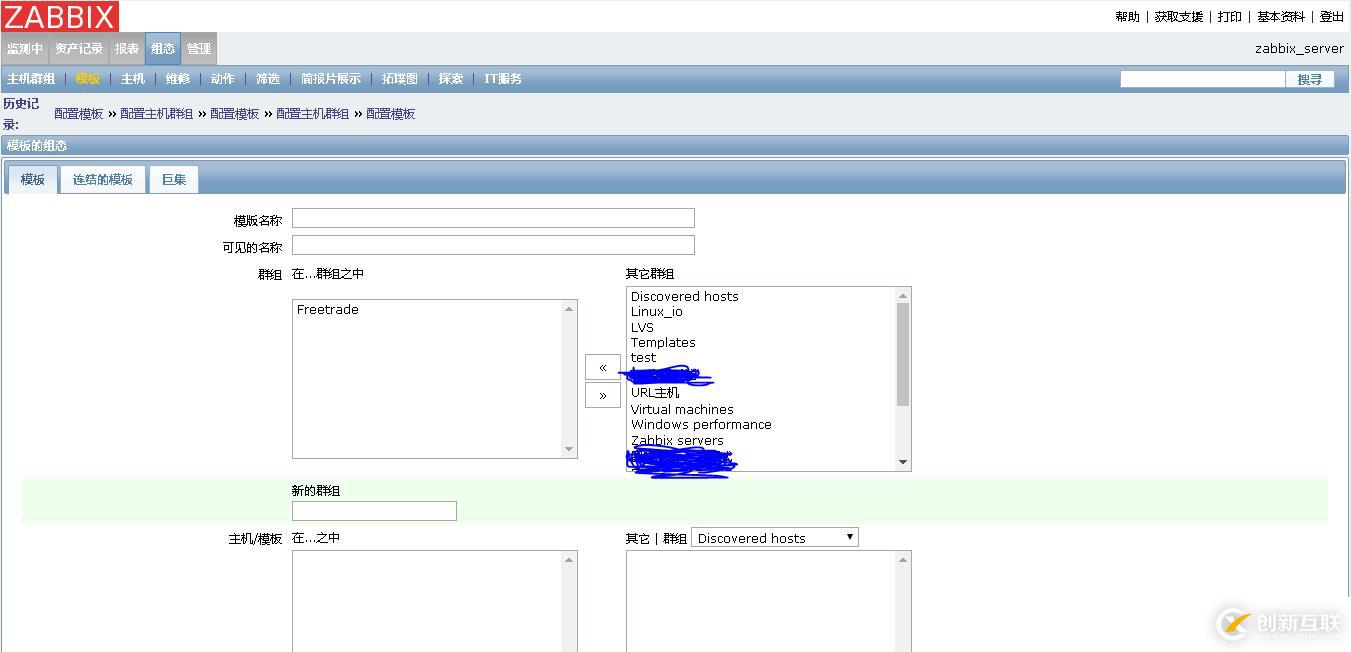
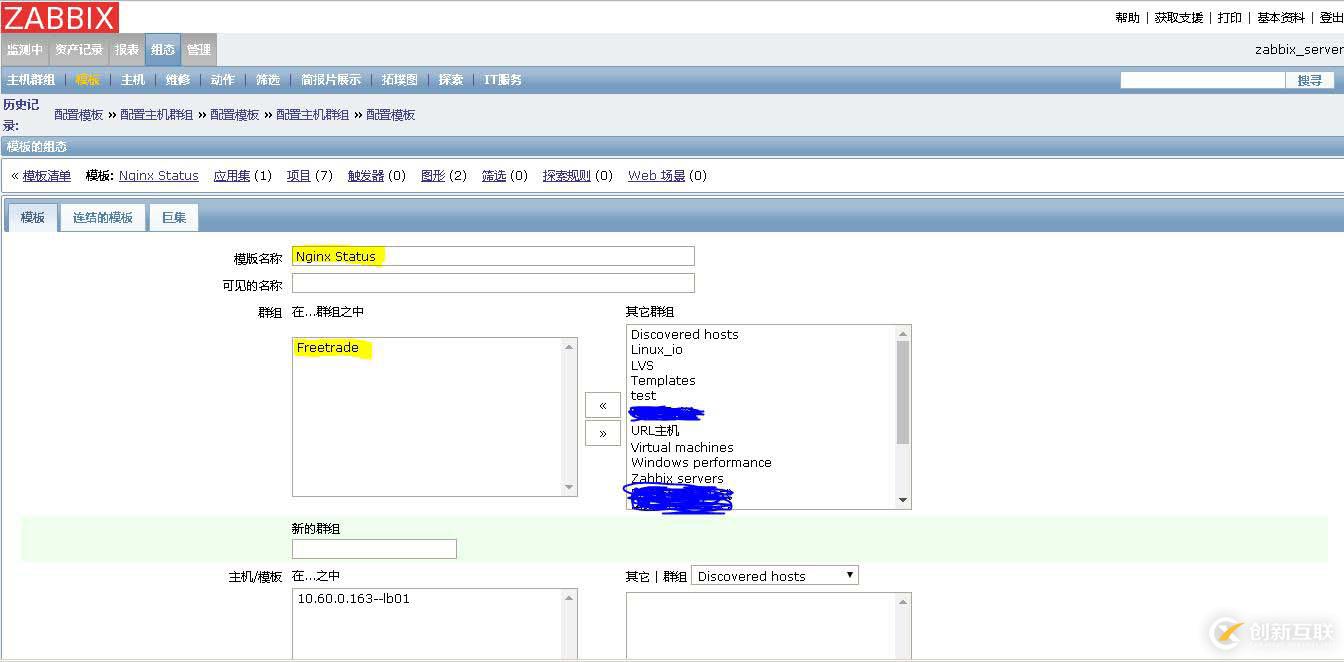
<?xml version="1.0" encoding="UTF-8" ?> - <zabbix_export> <version>2.0</version> <date>2017-06-27T13:30:39Z</date> - <groups> - <group> <name>Freetrade</name> </group> </groups> - <templates> - <template> <template>Nginx Status</template> <name>Nginx Status</name> - <groups> - <group> <name>Freetrade</name> </group> </groups> - <applications> - <application> <name>Nginx</name> </application> </applications> - <items> - <item> <name>Nginx Accepts</name> <type>7</type> <snmp_community /> <multiplier>0</multiplier> <snmp_oid /> <key>nginx.accepts</key> <delay>30</delay> <history>365</history> <trends>365</trends> <status>0</status> <value_type>3</value_type> <allowed_hosts>localhost</allowed_hosts> <units /> <delta>0</delta> <snmpv3_contextname /> <snmpv3_securityname /> <snmpv3_securitylevel>0</snmpv3_securitylevel> <snmpv3_authprotocol>0</snmpv3_authprotocol> <snmpv3_authpassphrase /> <snmpv3_privprotocol>0</snmpv3_privprotocol> <snmpv3_privpassphrase /> <formula>0</formula> <delay_flex /> <params /> <ipmi_sensor /> <data_type>0</data_type> <authtype>0</authtype> <username /> <password /> <publickey /> <privatekey /> <port /> <description /> <inventory_link>0</inventory_link> - <applications> - <application> <name>Nginx</name> </application> </applications> <valuemap /> </item> - <item> <name>Nginx Connections Active</name> <type>7</type> <snmp_community /> <multiplier>0</multiplier> <snmp_oid /> <key>nginx.connections.active</key> <delay>30</delay> <history>365</history> <trends>365</trends> <status>0</status> <value_type>3</value_type> <allowed_hosts>localhost</allowed_hosts> <units /> <delta>0</delta> <snmpv3_contextname /> <snmpv3_securityname /> <snmpv3_securitylevel>0</snmpv3_securitylevel> <snmpv3_authprotocol>0</snmpv3_authprotocol> <snmpv3_authpassphrase /> <snmpv3_privprotocol>0</snmpv3_privprotocol> <snmpv3_privpassphrase /> <formula>0</formula> <delay_flex /> <params /> <ipmi_sensor /> <data_type>0</data_type> <authtype>0</authtype> <username /> <password /> <publickey /> <privatekey /> <port /> <description /> <inventory_link>0</inventory_link> - <applications> - <application> <name>Nginx</name> </application> </applications> <valuemap /> </item> - <item> <name>Nginx Connections Reading</name> <type>7</type> <snmp_community /> <multiplier>0</multiplier> <snmp_oid /> <key>nginx.connections.reading</key> <delay>30</delay> <history>365</history> <trends>365</trends> <status>0</status> <value_type>3</value_type> <allowed_hosts>localhost</allowed_hosts> <units /> <delta>0</delta> <snmpv3_contextname /> <snmpv3_securityname /> <snmpv3_securitylevel>0</snmpv3_securitylevel> <snmpv3_authprotocol>0</snmpv3_authprotocol> <snmpv3_authpassphrase /> <snmpv3_privprotocol>0</snmpv3_privprotocol> <snmpv3_privpassphrase /> <formula>0</formula> <delay_flex /> <params /> <ipmi_sensor /> <data_type>0</data_type> <authtype>0</authtype> <username /> <password /> <publickey /> <privatekey /> <port /> <description /> <inventory_link>0</inventory_link> - <applications> - <application> <name>Nginx</name> </application> </applications> <valuemap /> </item> - <item> <name>Nginx Connections Waiting</name> <type>7</type> <snmp_community /> <multiplier>0</multiplier> <snmp_oid /> <key>nginx.connections.waiting</key> <delay>30</delay> <history>365</history> <trends>365</trends> <status>0</status> <value_type>3</value_type> <allowed_hosts>localhost</allowed_hosts> <units /> <delta>0</delta> <snmpv3_contextname /> <snmpv3_securityname /> <snmpv3_securitylevel>0</snmpv3_securitylevel> <snmpv3_authprotocol>0</snmpv3_authprotocol> <snmpv3_authpassphrase /> <snmpv3_privprotocol>0</snmpv3_privprotocol> <snmpv3_privpassphrase /> <formula>0</formula> <delay_flex /> <params /> <ipmi_sensor /> <data_type>0</data_type> <authtype>0</authtype> <username /> <password /> <publickey /> <privatekey /> <port /> <description /> <inventory_link>0</inventory_link> - <applications> - <application> <name>Nginx</name> </application> </applications> <valuemap /> </item> - <item> <name>Nginx Connections Writing</name> <type>7</type> <snmp_community /> <multiplier>0</multiplier> <snmp_oid /> <key>nginx.connections.writing</key> <delay>30</delay> <history>365</history> <trends>365</trends> <status>0</status> <value_type>3</value_type> <allowed_hosts>localhost</allowed_hosts> <units /> <delta>0</delta> <snmpv3_contextname /> <snmpv3_securityname /> <snmpv3_securitylevel>0</snmpv3_securitylevel> <snmpv3_authprotocol>0</snmpv3_authprotocol> <snmpv3_authpassphrase /> <snmpv3_privprotocol>0</snmpv3_privprotocol> <snmpv3_privpassphrase /> <formula>0</formula> <delay_flex /> <params /> <ipmi_sensor /> <data_type>0</data_type> <authtype>0</authtype> <username /> <password /> <publickey /> <privatekey /> <port /> <description /> <inventory_link>0</inventory_link> - <applications> - <application> <name>Nginx</name> </application> </applications> <valuemap /> </item> - <item> <name>Nginx Handled</name> <type>7</type> <snmp_community /> <multiplier>0</multiplier> <snmp_oid /> <key>nginx.handled</key> <delay>30</delay> <history>365</history> <trends>365</trends> <status>0</status> <value_type>3</value_type> <allowed_hosts>localhost</allowed_hosts> <units /> <delta>0</delta> <snmpv3_contextname /> <snmpv3_securityname /> <snmpv3_securitylevel>0</snmpv3_securitylevel> <snmpv3_authprotocol>0</snmpv3_authprotocol> <snmpv3_authpassphrase /> <snmpv3_privprotocol>0</snmpv3_privprotocol> <snmpv3_privpassphrase /> <formula>0</formula> <delay_flex /> <params /> <ipmi_sensor /> <data_type>0</data_type> <authtype>0</authtype> <username /> <password /> <publickey /> <privatekey /> <port /> <description /> <inventory_link>0</inventory_link> - <applications> - <application> <name>Nginx</name> </application> </applications> <valuemap /> </item> - <item> <name>Nginx Requests</name> <type>7</type> <snmp_community /> <multiplier>0</multiplier> <snmp_oid /> <key>nginx.requests</key> <delay>30</delay> <history>365</history> <trends>365</trends> <status>0</status> <value_type>3</value_type> <allowed_hosts>localhost</allowed_hosts> <units /> <delta>0</delta> <snmpv3_contextname /> <snmpv3_securityname /> <snmpv3_securitylevel>0</snmpv3_securitylevel> <snmpv3_authprotocol>0</snmpv3_authprotocol> <snmpv3_authpassphrase /> <snmpv3_privprotocol>0</snmpv3_privprotocol> <snmpv3_privpassphrase /> <formula>0</formula> <delay_flex /> <params /> <ipmi_sensor /> <data_type>0</data_type> <authtype>0</authtype> <username /> <password /> <publickey /> <privatekey /> <port /> <description /> <inventory_link>0</inventory_link> - <applications> - <application> <name>Nginx</name> </application> </applications> <valuemap /> </item> </items> <discovery_rules /> <macros /> <templates /> <screens /> </template> </templates> - <graphs> - <graph> <name>Nginx Clients Status</name> <width>900</width> <height>200</height> <yaxismin>0.0000</yaxismin> <yaxismax>100.0000</yaxismax> <show_work_period>1</show_work_period> <show_triggers>1</show_triggers> <type>0</type> <show_legend>1</show_legend> <show_3d>0</show_3d> <percent_left>0.0000</percent_left> <percent_right>0.0000</percent_right> <ymin_type_1>0</ymin_type_1> <ymax_type_1>0</ymax_type_1> <ymin_item_1>0</ymin_item_1> <ymax_item_1>0</ymax_item_1> - <graph_items> - <graph_item> <sortorder>0</sortorder> <drawtype>0</drawtype> <color>0000EE</color> <yaxisside>0</yaxisside> <calc_fnc>2</calc_fnc> <type>0</type> - <item> <host>Nginx Status</host> <key>nginx.connections.active</key> </item> </graph_item> - <graph_item> <sortorder>1</sortorder> <drawtype>0</drawtype> <color>EE0000</color> <yaxisside>0</yaxisside> <calc_fnc>2</calc_fnc> <type>0</type> - <item> <host>Nginx Status</host> <key>nginx.connections.writing</key> </item> </graph_item> - <graph_item> <sortorder>2</sortorder> <drawtype>0</drawtype> <color>EEEE00</color> <yaxisside>0</yaxisside> <calc_fnc>2</calc_fnc> <type>0</type> - <item> <host>Nginx Status</host> <key>nginx.connections.waiting</key> </item> </graph_item> - <graph_item> <sortorder>3</sortorder> <drawtype>0</drawtype> <color>00EE00</color> <yaxisside>0</yaxisside> <calc_fnc>2</calc_fnc> <type>0</type> - <item> <host>Nginx Status</host> <key>nginx.connections.reading</key> </item> </graph_item> </graph_items> </graph> - <graph> <name>Nginx Socket Status</name> <width>900</width> <height>200</height> <yaxismin>0.0000</yaxismin> <yaxismax>100.0000</yaxismax> <show_work_period>1</show_work_period> <show_triggers>1</show_triggers> <type>0</type> <show_legend>1</show_legend> <show_3d>0</show_3d> <percent_left>0.0000</percent_left> <percent_right>0.0000</percent_right> <ymin_type_1>0</ymin_type_1> <ymax_type_1>0</ymax_type_1> <ymin_item_1>0</ymin_item_1> <ymax_item_1>0</ymax_item_1> - <graph_items> - <graph_item> <sortorder>0</sortorder> <drawtype>0</drawtype> <color>00EE00</color> <yaxisside>0</yaxisside> <calc_fnc>2</calc_fnc> <type>0</type> - <item> <host>Nginx Status</host> <key>nginx.accepts</key> </item> </graph_item> - <graph_item> <sortorder>0</sortorder> <drawtype>0</drawtype> <color>EE0000</color> <yaxisside>0</yaxisside> <calc_fnc>2</calc_fnc> <type>0</type> - <item> <host>Nginx Status</host> <key>nginx.handled</key> </item> </graph_item> - <graph_item> <sortorder>1</sortorder> <drawtype>0</drawtype> <color>EEEE00</color> <yaxisside>0</yaxisside> <calc_fnc>2</calc_fnc> <type>0</type> - <item> <host>Nginx Status</host> <key>nginx.requests</key> </item> </graph_item> </graph_items> </graph> </graphs> </zabbix_export>首先你要先在zabbix web端创建一个空的templates即模板如下图:
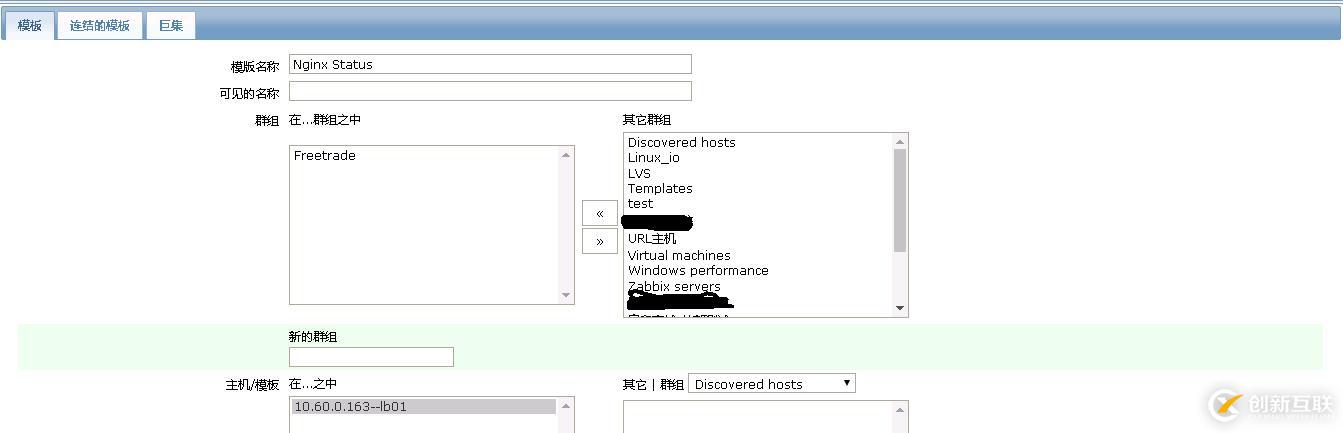
"组态--模板"-->到右上角"创建模板",填入你想要的模板名称,以及所属于该模板的主机,最后保存

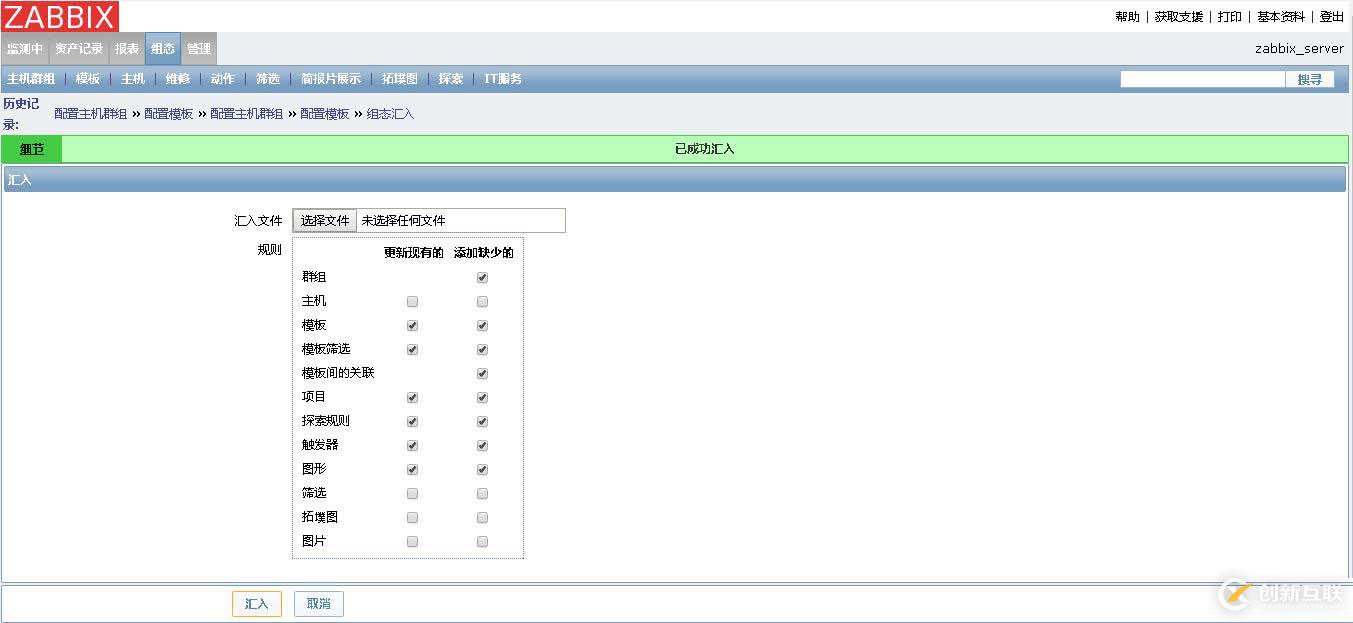
把你下载好并修改成适合你的模板汇入到原创建好的空templates内,当然只要导入成功的话,你可以后期进templates去修改成适合你的。
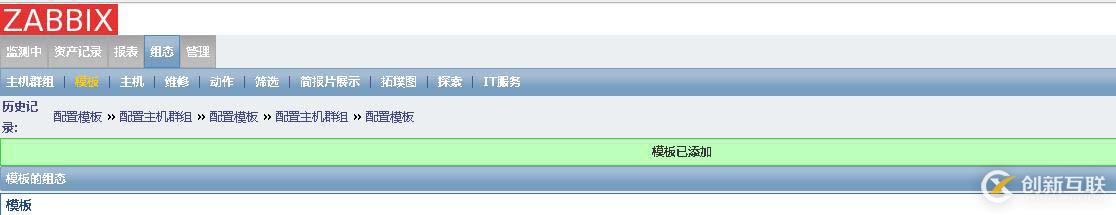
选择右上角的"汇入"--"选择文件"--"汇入"
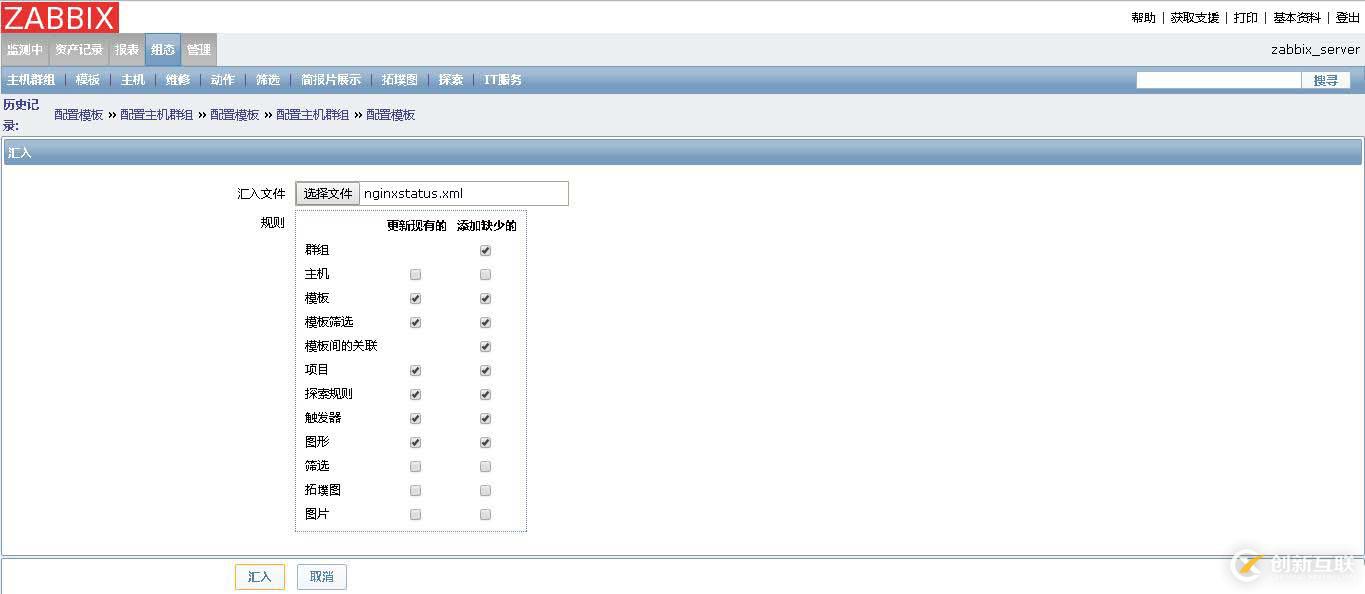
要出现汇入成功的提示,才说明你的模板是合适的,但是合适不一定有用哦
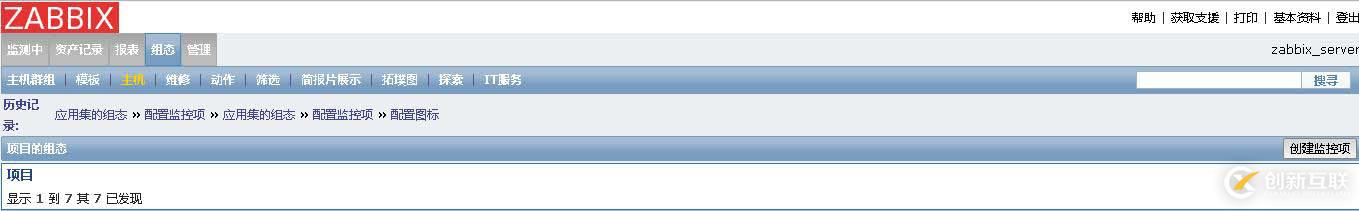
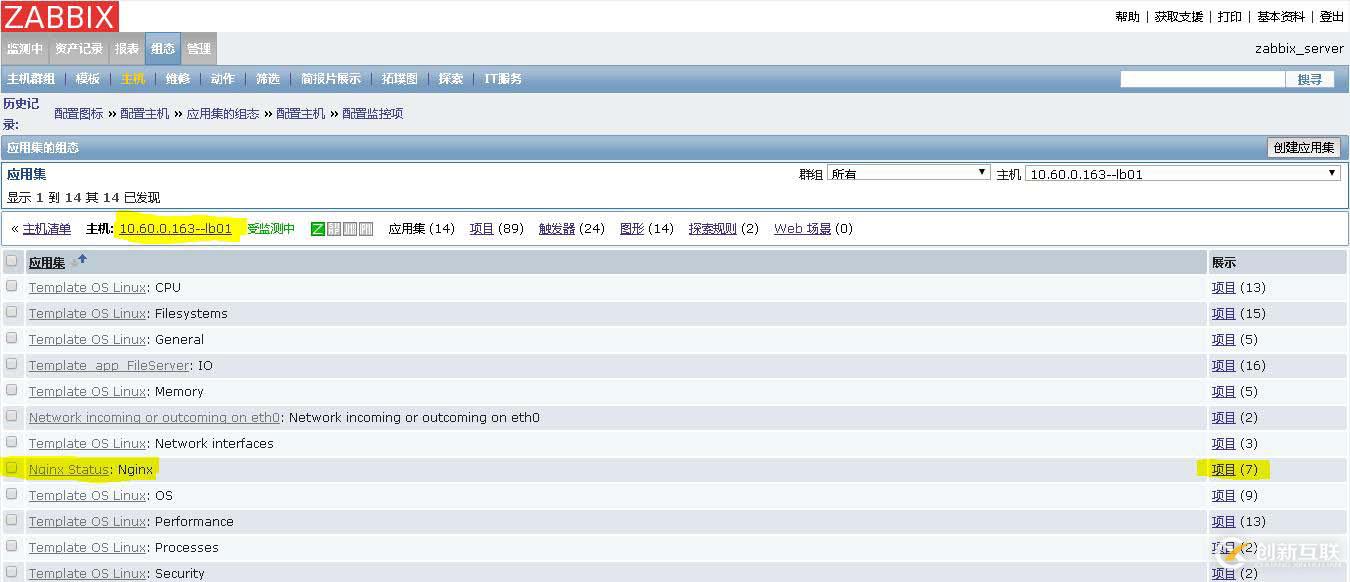
然后把你要的监控的Nginx主机纳入到模板上去,再然后到被监控的Nginx主机里去查看,该模块是否被连结了
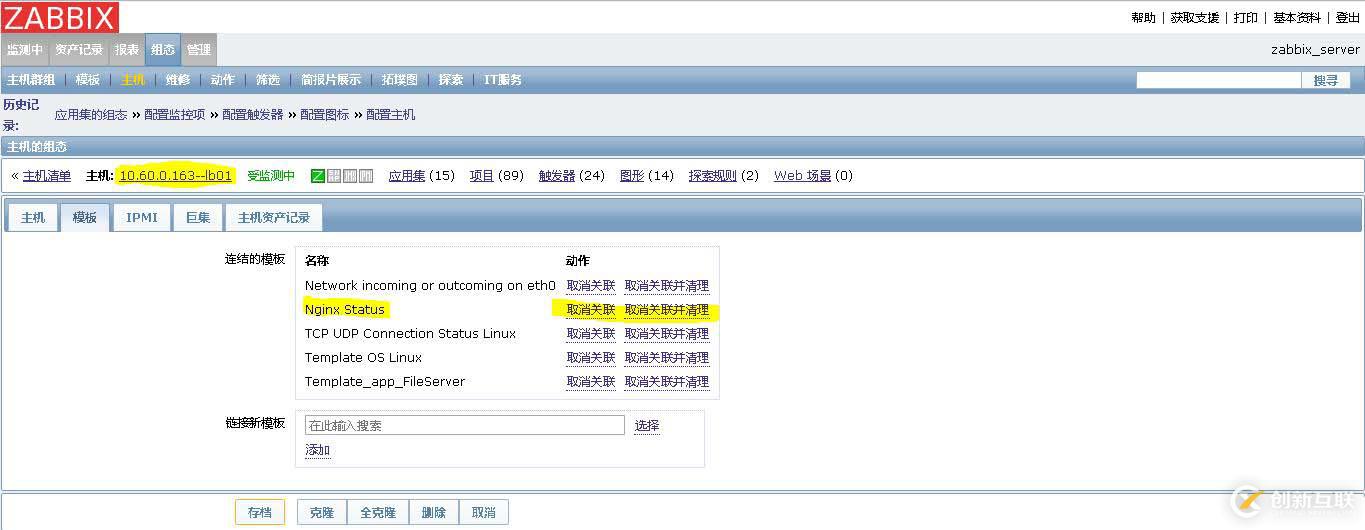
你应该可以看到你的Nginx主机上多了一些图形及项目,且在模板上已经链接到了你设定的新模板了
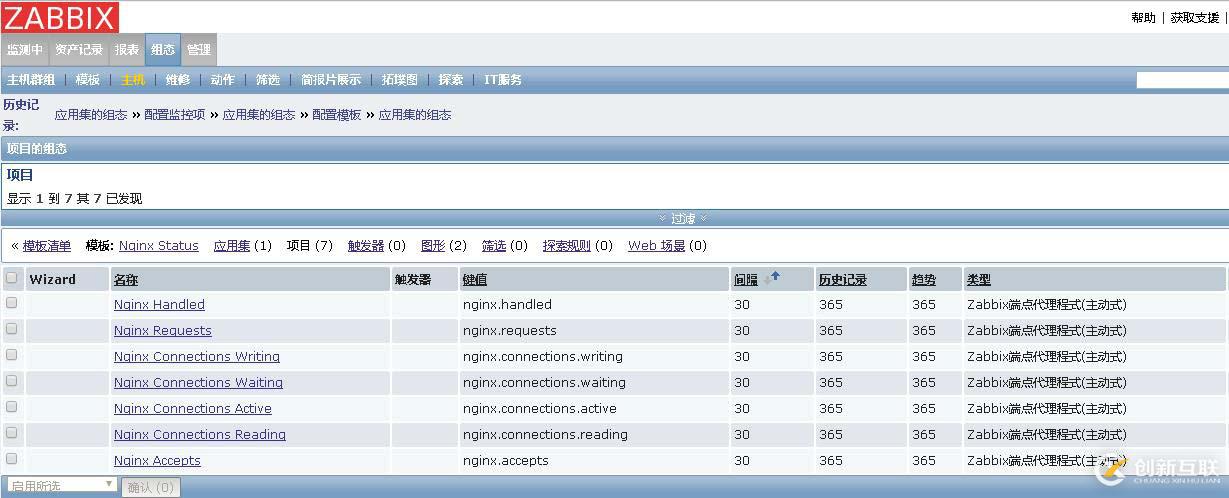
如果点进去看,nginx主机的监控项目中,Nginx服务相关的监控项目为Zabbix端点代理程式(主动式)哦
当然如果你没有导入模板成功,那你就老老实实一个个创建吧,不过也很简单啦!一步一步来就好了,多做加深印象,还便于理解
先建立新模板

在新建模板里增加一个应用集


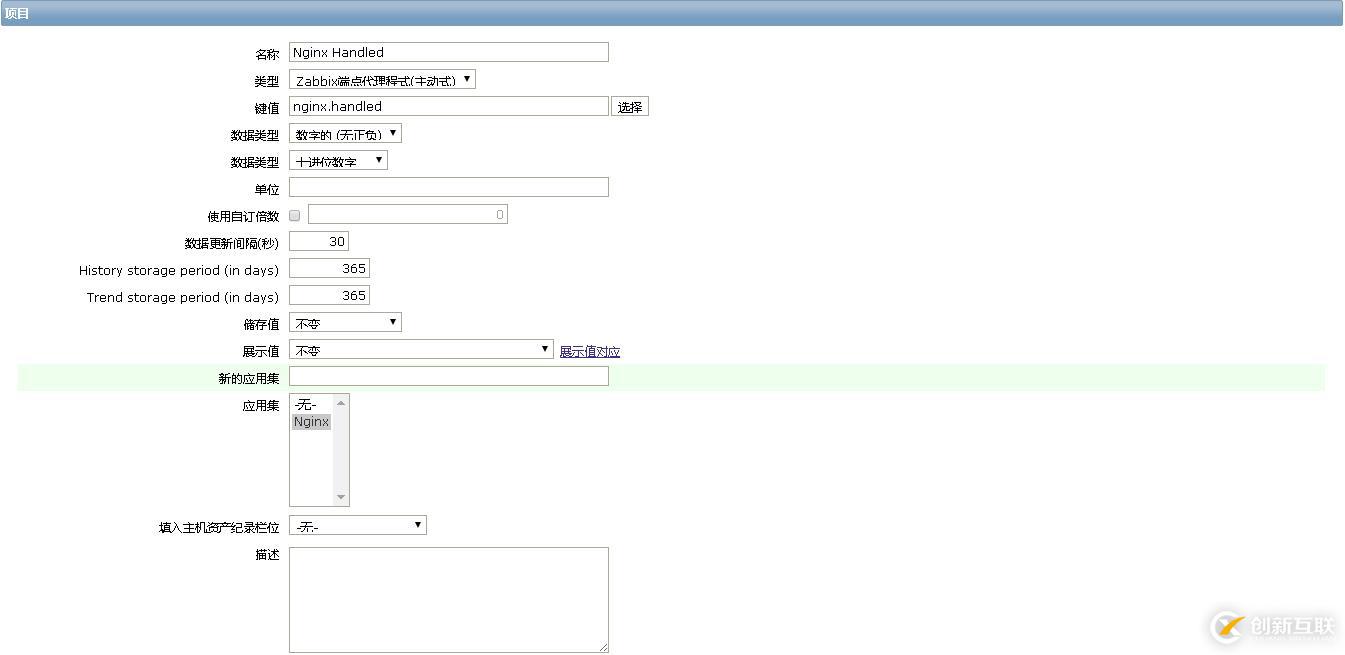
添加监控项进入新建模板,添加的内容一项一项地加,大致基本相同,唯一不同处是键值和名称
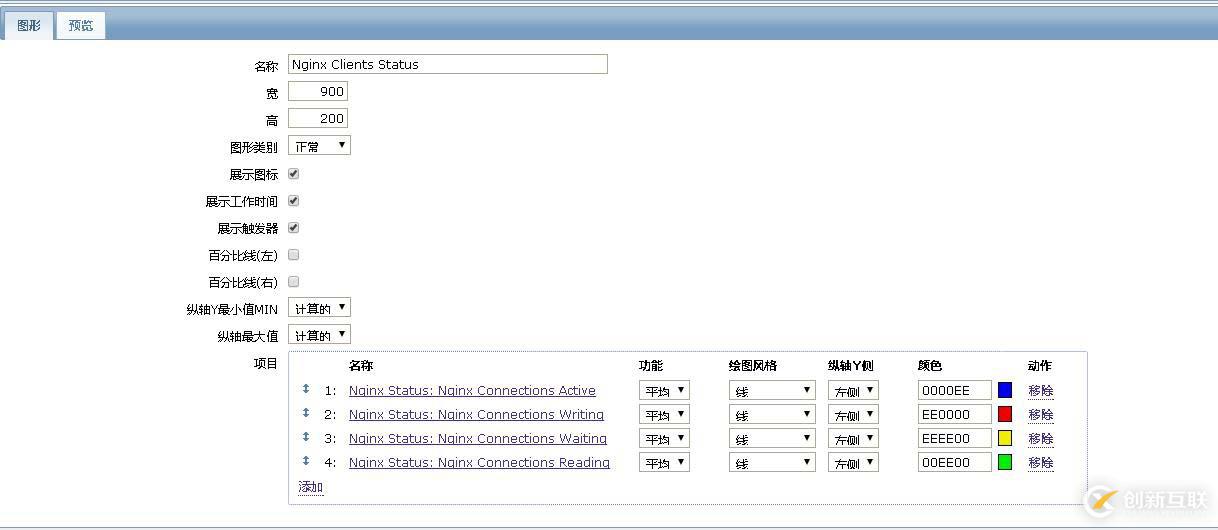
增加图形监控,到这里,只要你把监控项目创建好,在图形监控只要选择你要呈现图形的监控项目即可
到监控主机里进模板连结,直接选择现有的模板,然后添加保存

从上面看被监控主机已经载入新模板且项目集也存在了
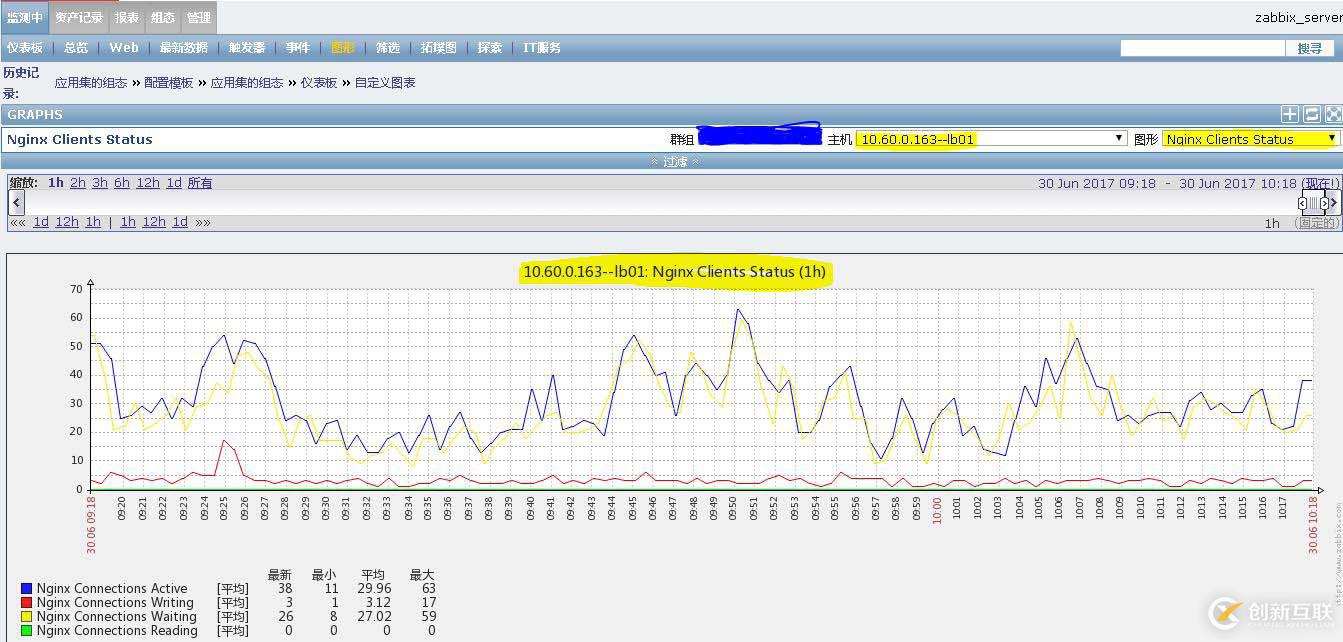
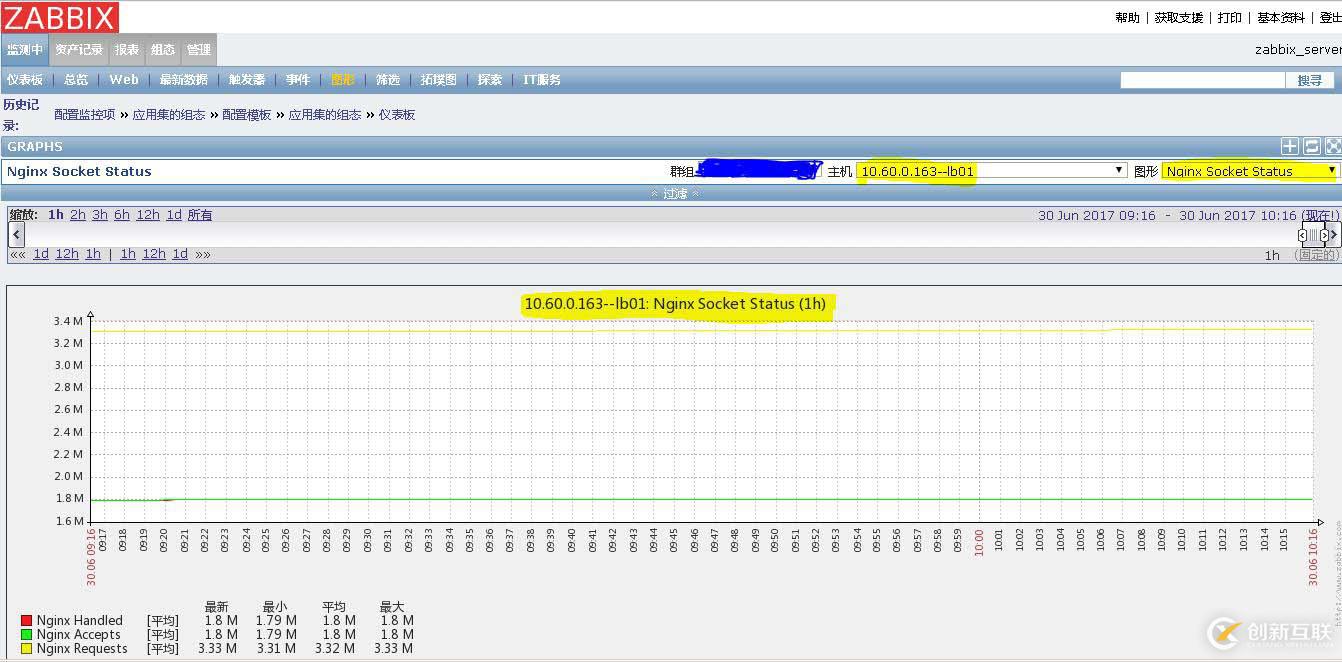
最后查看通过"监测中"--"图形"选择被监控主机的图形名称,来看看图是否有加载Nginx Client Status,Nginx Socket Status;如果有,恭喜你,监控设置就说明成功了!
如果想做些告警之类的,可以在规则中设定触发器即可了,因为大家需求各不相同,故在此就不再多说了。
附件:http://down.51cto.com/data/2366804另外有需要云服务器可以了解下创新互联cdcxhl.cn,海内外云服务器15元起步,三天无理由+7*72小时售后在线,公司持有idc许可证,提供“云服务器、裸金属服务器、高防服务器、香港服务器、美国服务器、虚拟主机、免备案服务器”等云主机租用服务以及企业上云的综合解决方案,具有“安全稳定、简单易用、服务可用性高、性价比高”等特点与优势,专为企业上云打造定制,能够满足用户丰富、多元化的应用场景需求。
文章名称:Nginx服务纳入到zabbix监控-创新互联
URL标题:https://www.cdcxhl.com/article48/dhochp.html
成都网站建设公司_创新互联,为您提供用户体验、网站建设、做网站、虚拟主机、关键词优化、建站公司
声明:本网站发布的内容(图片、视频和文字)以用户投稿、用户转载内容为主,如果涉及侵权请尽快告知,我们将会在第一时间删除。文章观点不代表本网站立场,如需处理请联系客服。电话:028-86922220;邮箱:631063699@qq.com。内容未经允许不得转载,或转载时需注明来源: 创新互联

- 整站SEO与关键词优化本质有什么区别? 2020-12-26
- 网站关键词优化排名的稳定性与网站质量的关系详解 2016-10-30
- 网站关键词优化不能看价格要看最终的效果 2016-10-30
- 如何把网站关键词优化到首页? 2023-02-19
- seo关键词优化公司哪家好? 2022-07-20
- 网站提高关键词优化排名效果(技巧大全) 2020-11-22
- SEO关键词优化效果不显著应该重视什么内容? 2015-03-24
- 盘点:长尾关键词优化的方法 2015-11-17
- 关键词优化的重要性 2015-06-25
- 企业网站搜索引擎关键词优化前期需要做好哪些准备? 2022-06-19
- 为什么说关键词优化排名贵在坚持? 2015-05-15
- 网站关键词优化怎样才能达到良好的排名效果? 2023-03-29