MySQL-MongoDB开源监控利器之PMM-创新互联
最近要对数据库的监控体系进行改进,发现Percona 公司的一款开源的监控工具Percona Monitoring and Management(PMM) 对于MySQL的监控指标各项值比较全面准确,现在公司内部的开发测试环境进行了部署体验。

主要的架构图如下:源于官方

可以看到主要是由客户端的代理程序node_export\mysqld_export\mongodb_export等和客户端管理工具pmm-admin做为数据的收集方式并发送到服务端的QAN API\Consul API\Prometheus等各个API然后通过Grafana来展示数据指标,界面非常靓丽
Pmm 的server端的运行方式主要有官方提供的以下三种方式:
1.已经集成好的Docker方式
2.集成好的VirtualBox方式
3. Amazon Machine Image (AMI)
在这里我用的是Docker方式,轻量部署、升级很方便
PMM的client安装比较方便,直接安装官方的yum安装就OK了
#详细的请参考官方文档
https://www.percona.com/doc/percona-monitoring-and-management/index.html
#Dokcer方式部署
提前准备好系统和Docker服务,安装不在这里展示
1-创建容器的数据磁盘
docker create \
   -v /opt/prometheus/data \
   -v /opt/consul-data \
   -v /var/lib/mysql \
   -v /var/lib/grafana \
   --name pmm-data \
   percona/pmm-server:1.1.1 /bin/true
2-创建容器的运行实例
docker run -d \
   -p 80:80 \
   --volumes-from pmm-data \
   --name pmm-server \
   --restart always \
   percona/pmm-server:1.1.1
#客户端安装
[root@master ~]# yum install http://www.percona.com/downloads/percona-release/redhat/0.1-4/percona-release-0.1-4.noarch.rpm
[root@master ~]# yum install -y pmm-client
#增加客户端mysql监控
[root@master ~]# pmm-admin config --server 192.168.100.171
OK, PMM server is alive.
PMM Server | 192.168.100.171
Client Name | master.wboy.com
Client Address | 192.168.100.41
[root@master ~]# pmm-admin list
pmm-admin 1.1.1
PMM Server | 192.168.100.171
Client Name | master.wboy.com
Client Address | 192.168.100.41
Service Manager | unix-systemv
No monitoring registered for this node identified as 'master.wboy.com'.
#命令帮助
[root@master ~]# pmm-admin add --help
This command is used to add a monitoring service.
Usage:
pmm-admin add [command]
Available Commands:
mysql Add complete monitoring for MySQL instance (linux and mysql metrics, queries).
linux:metrics Add this system to metrics monitoring.
mysql:metrics Add MySQL instance to metrics monitoring.
mysql:queries Add MySQL instance to Query Analytics.
mongodb Add complete monitoring for MongoDB instance (linux and mongodb metrics).
mongodb:metrics Add MongoDB instance to metrics monitoring.
proxysql:metrics Add ProxySQL instance to metrics monitoring.
Flags:
--service-port uint16 service port
Global Flags:
-c, --config-file string PMM config file (default "/usr/local/percona/pmm-client/pmm.yml")
Use "pmm-admin add [command] --help" for more information about a command.
[root@master ~]# pmm-admin add mysql --help
This command adds the given MySQL instance to system, metrics and queries monitoring.
When adding a MySQL instance, this tool tries to auto-detect the DSN and credentials.
If you want to create a new user to be used for metrics collecting, provide --create-user option. pmm-admin will create
a new user 'pmm@' automatically using the given (auto-detected) MySQL credentials for granting purpose.
Table statistics is automatically disabled when there are more than 10000 tables on MySQL.
[name] is an optional argument, by default it is set to the client name of this PMM client.
Usage:
pmm-admin add mysql [name] [flags]
Examples:
pmm-admin add mysql --password abc123
pmm-admin add mysql --password abc123 --create-user
pmm-admin add mysql --password abc123 --port 3307 instance3307
Flags:
--create-user create a new MySQL user
--create-user-maxconn uint16 max user connections for a new user (default 10)
--create-user-password string optional password for a new MySQL user
--defaults-file string path to my.cnf
--disable-binlogstats disable binlog statistics
--disable-processlist disable process state metrics
--disable-tablestats disable table statistics
--disable-tablestats-limit uint16 number of tables after which table stats are disabled automatically (default 1000)
--disable-userstats disable user statistics
--force force to create/update MySQL user
--host string MySQL host
--password string MySQL password
--port string MySQL port
--query-source string source of SQL queries: auto, slowlog, perfschema (default "auto")
--socket string MySQL socket
--user string MySQL username
Global Flags:
-c, --config-file string PMM config file (default "/usr/local/percona/pmm-client/pmm.yml")
--service-port uint16 service port
#增加本地mysql实例
[root@master ~]# pmm-admin add mysql --user root --password root
[linux:metrics] OK, now monitoring this system.
[mysql:metrics] OK, now monitoring MySQL metrics using DSN root:***@unix(/var/lib/mysql/mysql.sock)
[mysql:queries] OK, now monitoring MySQL queries from slowlog using DSN root:***@unix(/var/lib/mysql/mysql.sock)
安装完成后的访问地址列表:其实在 landing page包含了下面三个功能的页面
| 各个组件 | 功能访问地址 |
|---|---|
| PMM landing page | http://192.168.100.1 |
| Query Analytics (QAN web app) | http://192.168.100.1/qan/ |
| Metrics Monitor (Grafana) | http://192.168.100.1/graph/ User name: admin Password: admin |
| Orchestrator | http://192.168.100.1/orchestrator |
##
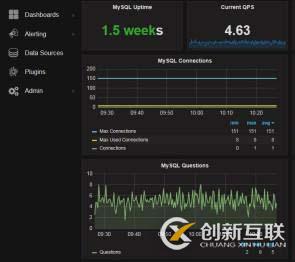
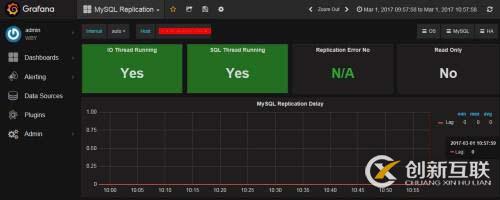
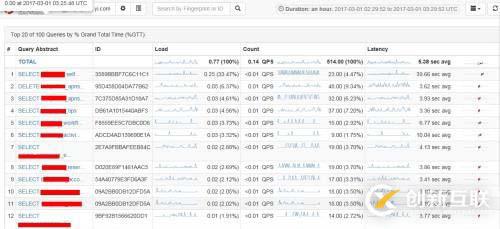
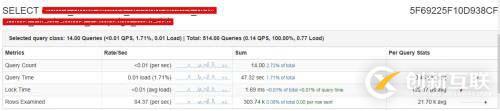
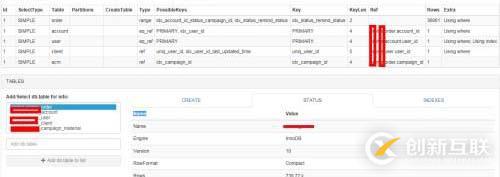
下面是一些截图界面
另外有需要云服务器可以了解下创新互联cdcxhl.cn,海内外云服务器15元起步,三天无理由+7*72小时售后在线,公司持有idc许可证,提供“云服务器、裸金属服务器、高防服务器、香港服务器、美国服务器、虚拟主机、免备案服务器”等云主机租用服务以及企业上云的综合解决方案,具有“安全稳定、简单易用、服务可用性高、性价比高”等特点与优势,专为企业上云打造定制,能够满足用户丰富、多元化的应用场景需求。
网站栏目:MySQL-MongoDB开源监控利器之PMM-创新互联
文章源于:https://www.cdcxhl.com/article38/edopp.html
成都网站建设公司_创新互联,为您提供服务器托管、移动网站建设、网站设计公司、定制网站、搜索引擎优化、网站排名
声明:本网站发布的内容(图片、视频和文字)以用户投稿、用户转载内容为主,如果涉及侵权请尽快告知,我们将会在第一时间删除。文章观点不代表本网站立场,如需处理请联系客服。电话:028-86922220;邮箱:631063699@qq.com。内容未经允许不得转载,或转载时需注明来源: 创新互联

- 网站建设如何保证安全 应对策略有哪些 2021-04-23
- 响应式网站建设相比传统网站形式有哪些好处 2016-04-25
- 如何提升网站建设的整体效果 2023-03-07
- 企业网站建设选词是关键 2013-10-05
- 微网站与网站建设是辞旧迎新嘛,PC端网站建设如何逆流而上? 2022-11-29
- 高端网站建设报价怎么收费 2021-08-29
- 北京网站建设公司谈SEO网站优化是吹牛 2021-06-07
- 商城网站建设需要满足哪些用户需求呢 2021-09-15
- 重庆网站建设公司到底哪家公司好? 2021-01-25
- 网站制作前期需要考虑哪些问题? 2022-06-16
- 旅游网站建设设计制作方案与价格 2022-06-02
- 网站建设设计趋势 2017-02-16